This blog talks about monitoring and logging architectures for hybrid and multi-cloud deployments and provides best practices for implementing using Google Cloud.
Google Cloud has partnered with Blue Medora ( BindPlane) to bring you a single solution to save time and money in managing your logs in a single place.
Introduction to Blue Medora BindPlane
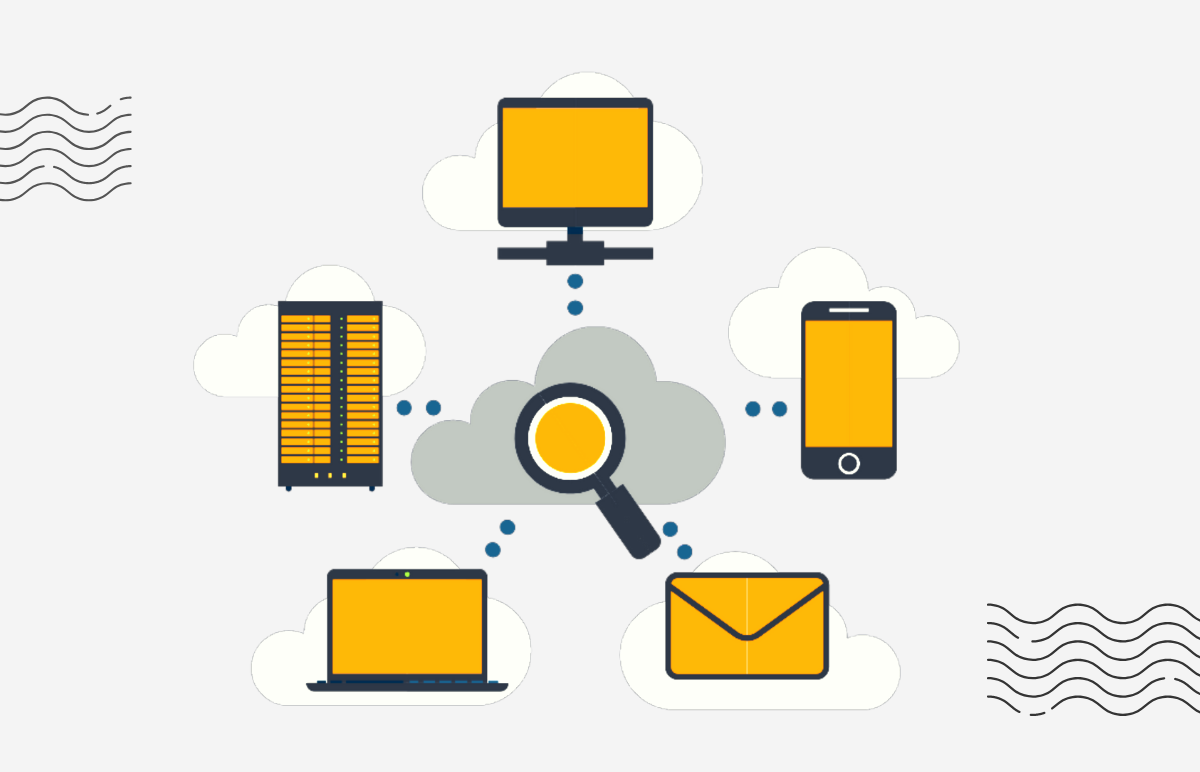
Blue Medora provides monitoring and logging services for multiple platforms in a consistent and predictable way. Customers can collect their own data and send it to Cloud Logging and Cloud Monitoring for analysis.
BindPlane is a first-of-its-kind service that connects all your health and performance data with any of your monitoring and analytics platforms.
BindPlane is the only IT operations data management platform that can deliver a relationship-aware stream of metrics and logs in real-time.
This is the first MIaas – Monitoring Integration as a service.
- On-premises
- Cloud
Organization has resources deployed to Google Cloud, Microsoft Azure, AWS, and on-premises resources deployed by using VMs.
Organization wants to collect logs for each component regardless of where the component is deployed. Sending the logs from each environment to Logging by using BindPlane agents brings all the logs into a single location for centralized reporting, monitoring, and operational purposes.
How it works
Blue Medora’s Bindplane integrates with Monitoring and Logging, allowing you to capture metrics and logs from parts of your infrastructure that are not covered by the Monitored resources. These resources include:
- Platforms like Microsoft Azure Compute and VMware vCenter
- Line-of-business applications like Oracle EBS and JBoss
- Database engines like Microsoft SQL Server and OracleDB
Blue Medora sends the metrics to Cloud Monitoring, where you can visualize and analyze this data like any other built-in metrics. These metrics are charged as custom metrics, but there are no additional costs, licenses, or contracts needed to use BindPlane.In Blue Medora’s terms, collectors capture metrics from sources and send the metrics to destinations. Monitoring is one of the available destinations.
Using Blue Medora with Monitoring and Logging involves the following steps
- The Blue Medora collector component runs on each resource you want to monitor.
- The BindPlane agent is typically installed and configured on the system where the log files exist.
- Blue Medora’s BindPlane component intercepts and aggregates the data from the individual collectors. Bindplane lets you specify the metrics and logs you are interested in. It preprocesses the data before sending it to Monitoring and Logging.
- Bindplane sends the metric data to Cloud Monitoring for ingestion.
Observations in Log Compatibility with BindPlane
BindPlane supports more than 50 types of log sources which consists of Oracle, mySQL, postgreSQL, Tomcat, NGINX etc.
Deployment Model
On-Premises
There are basically two reasons you might be considering Logging and monitoring on-premises resources.
- If you want a temporary solution while you move infrastructure to Google Cloud and you want to log and monitor your on-premises resources until they’re decommissioned.
- Or you might have a diverse computing environment with multiple clouds and on-premises resources.
1.1 Approach
Get the logs into Logging by using API in two ways:
- Use the BindPlane tool from Blue Medora to ingest logs from your on-premises or other cloud sources.
- Use the Cloud Logging API directly from your app or by using a custom agent.
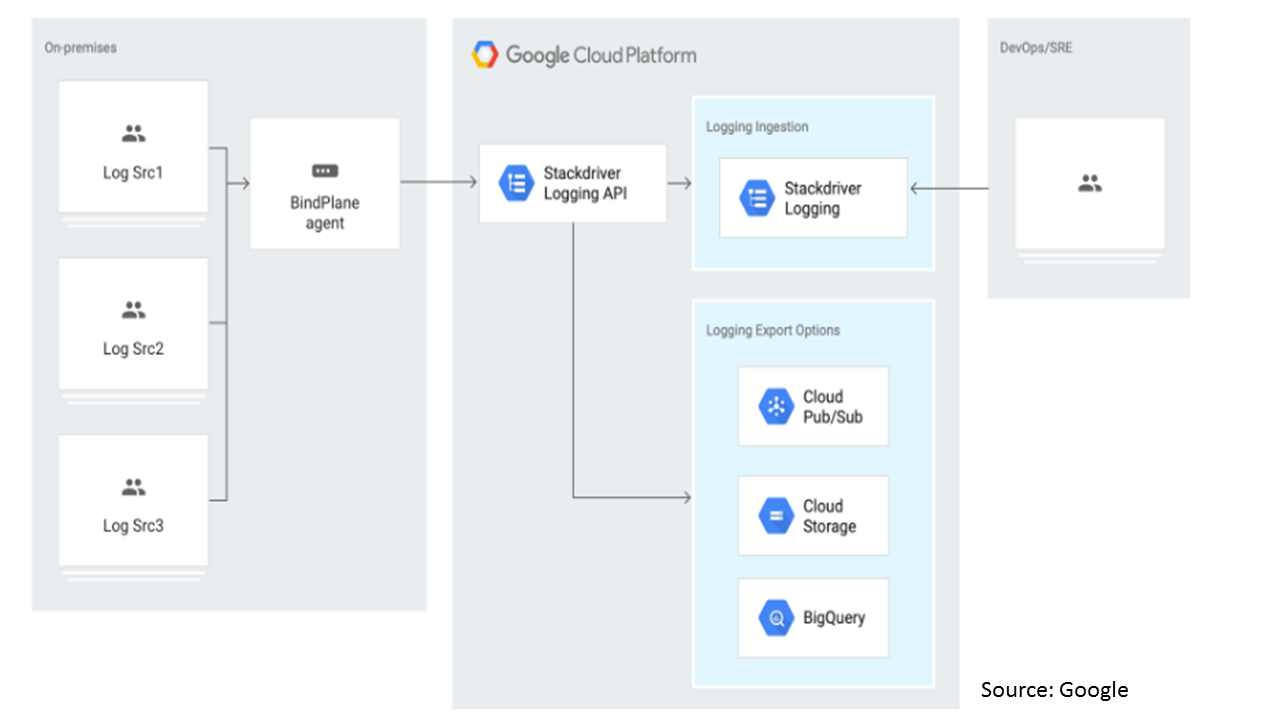
BindPlane provides an integrated service to ingest on-premises logs into Logging. BindPlane uses the Logging APIs by means of a Fluentd agent to send logs to Logging, which is similar to the operation of the Logging agent.
This option requires the lowest amount of effort to deploy because it requires configuration to set up rather than development.
Advantages
- Requires configuration, not development.
- Included in the cost of using Logging.
- Is a supported configuration by Logging product and support.
Disadvantages
- Requires the use of a third-party tool.
Might need to provide the Fluentd plugin configuration if the log plugin isn’t provided by default. The provided list of logs is available in Sources.
1.2 Using BindPlane
This solution covers using the BindPlane tool from Blue Medora to ingest logs into Logging. Because it’s included in the cost of Logging, BindPlane doesn’t require development and provides a product-supported solution.
How logs is being send
After you set up BindPlane and start sending logs, those logs are sent to Logging.
To view, process, and export logs, go to the GCP Console
The logs are listed as generic_node or generic_task resource types.
Generic Mode: Identifies a machine or other computational resource for which no other resource type is applicable.
Generic task: Identifies an app process for which no other resource is applicable, such as a process scheduled by a custom orchestration system.
Hybrid and multi-cloud monitoring and logging patterns
This section describes monitoring and logging architectures for hybrid and multi-cloud deployments.
Cloud-based hybrid monitoring assumptions
- You don’t depend on existing on-premises monitoring systems.
- Your workloads do not have regulatory or policy requirements to store log data on-premises.
- Your cloud-based monitoring systems have APIs or other mechanisms available to ingest log data from on-premises applications and services.
Multi-cloud
Integrating logging and reporting capabilities across a multiple-cloud platform can be complicated. Services offered between platforms are often not directly comparable, and logging and telemetry capabilities provided by these services differ as well.
Multicloud logging support often requires the use of gateway services to process log data into a common format before submitting data to a hybrid logging solution.
For example: Azure Monitor is the default and reporting service in Microsoft Azure
Hybrid monitoring and logging with Monitoring and BlueMedora BindPlane
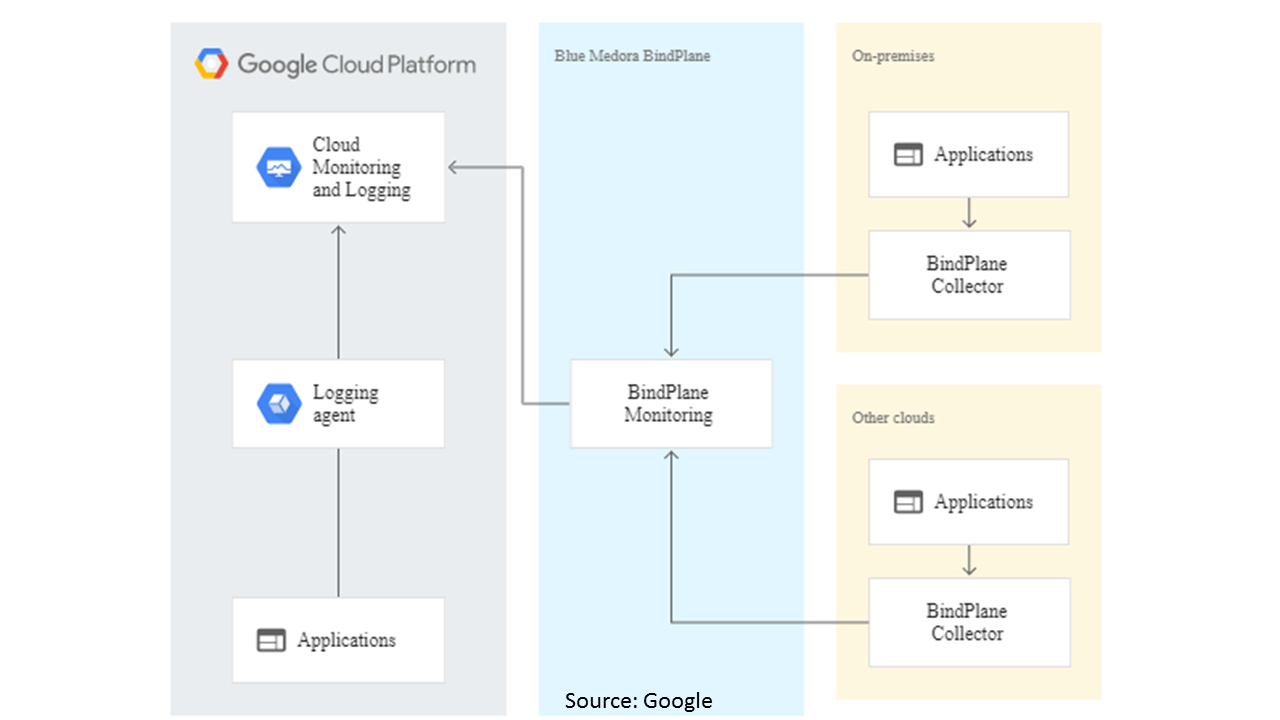
There is provision for import monitoring and logging data from both on-premises VMs and other cloud providers, such as Amazon Web Services (AWS), Microsoft Azure, Alibaba Cloud, and IBM Cloud into Monitoring.
The following diagram shows how Monitoring and BindPlane can provide a single pane of glass for a hybrid cloud.
Hybrid GKE logging with Fluentd and Logging
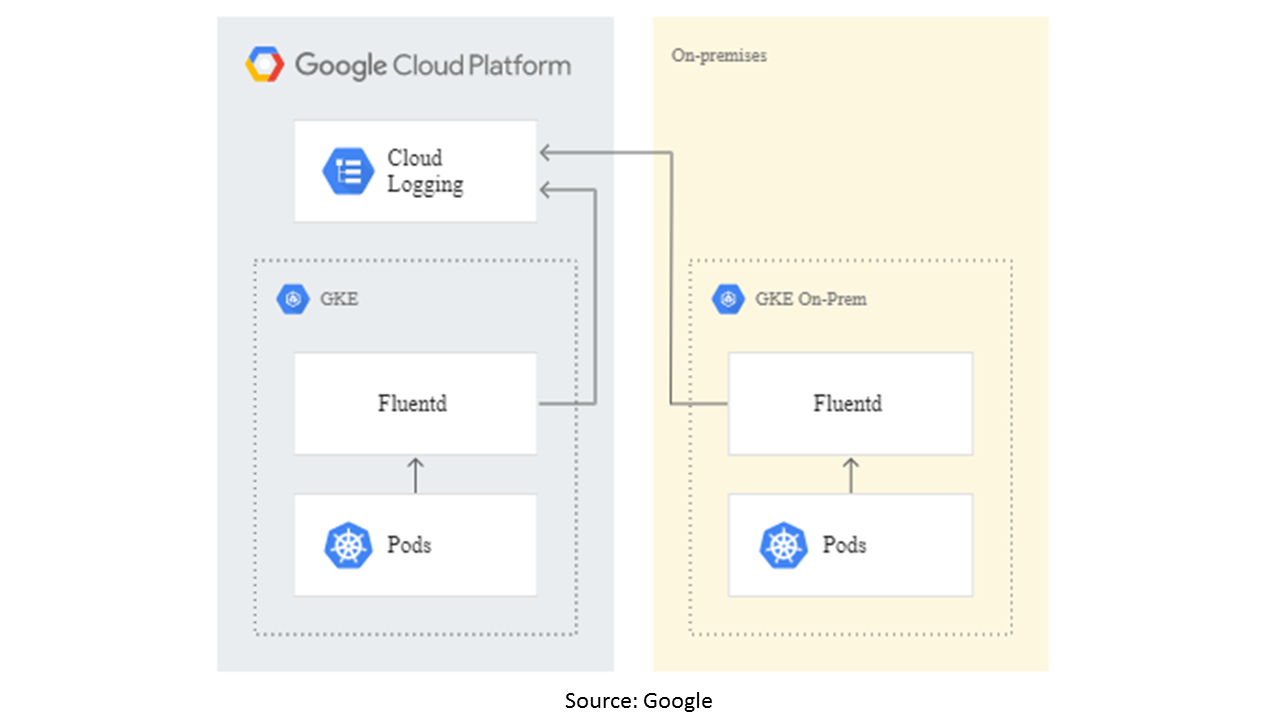
Fluentd is a popular open-source logging agent and Cloud Logging, you can ingest logs from applications running on multiple GKE clusters to Cloud Logging.
This architecture is useful when running Kubernetes workloads distributed across GKE on Google Cloud and GKE on-prem in your on-premises data center because it provides a unified interface across both.
The following diagram illustrates the flow of logs.
Advantages
- Can have consistent Kubernetes logging across cloud and on-premises environments.
- Can customize Logging to filter out sensitive information.
- There are no additional licensing costs for using Fluentd. Fluentd logs imported into Logging are charged at standard rates.
Disadvantages
- Fluentd supports logging only, so monitoring has to be configured separately.
Conclusion
With logs available, you can take advantage of the full use of the Logging features. You can export logs with Logging exports and use them to create metrics and alerts in monitoring by using logs-based metrics in on-premises and cloud hybrid environment.
.
.
.
About Datametica
A Global Leader in Data Warehouse Modernization & Migration. We empower businesses by migrating their Data/Workload/ETL/Analytics to the Cloud by leveraging Automation.

